Sigma Computing: The seven year journey to build the ultimate business intelligence tool
Startup Spotlight #11
Today, we have a piece on the next big company from Sutter Hill Ventures. SHV is famous for incubating massive companies like Snowflake, Pure Storage, Sila Nanotechnologies, and more.
Not only do I think Sigma is a fascinating product, but the story is even better. Three years testing. Three years building. 7+ years down the road, they are on the path to being the next multi-billion dollar homerun. Talk about resilience! Enjoy!
The context: The explosion in Cloud Data Infrastructure
It is almost impossible to understate the importance of cloud technology. I still remember trying to explain to my grandfather the novel concept of storing your phone data "in a cloud."
The past decade has seen an explosion in cloud technology, and the next decade will too. The cloud market has been way bigger than anyone ever anticipated.

As of Q2 2021, Amazon Web Services, Azure, and Google Cloud combined for an annualized revenue run-rate of $115B, growing at 44%!!!!

And this is still the early stages. Battery Ventures expects cloud computing spend to almost triple by 2025.
In particular, data & analytics has soared. Increased digitization + cheap, fast, & scalable cloud-storage has led organizations to capture more data points then ever before. Data is the new oil.
Data, however, is only good if it usable. Understandably, there has been a huge wave of tools to help companies with manage & leverage their data.

If you find the data infrastructure landscape overwhelming, you are not alone. It is huge. It is complex. But there is an eye-popping amount of value creation. Consider these valuations, all of which have been founded within the last 10 years:
Snowflake (2012): $92B (as of 2/15)
Databricks (2013): ~$38B (Source)
ScaleAI (2016): ~$7B (Source)
Fivetran (2012): ~$6B (Source)
Datarobot (2012): ~$6B (Source)
Starburst (2017): ~$3B (Source)
If you are a data scientist or data engineer, then your day-to-day and the tools at your disposal are VERY different than they were 10 years ago. As a result, it is hard for companies to fill the talent gap with qualified people. Data science has consistently been on LinkedIn Top Jobs Report, growing ~74% in four years.
The problem: The disconnect between data architecture & the business
The world of data architecture has changed dramatically, but how has this impacted the ways business decision-makers engage with data?
Your first reaction might be to say dramatically... but has it?
If you are in marketing, sales, operations, finance, etc., how much are you really feeling the impact & wonder of Snowflake? Let me explain by walking through four concepts:
The Power of Data: Closing the feedback loop
Bottlenecks: The data gatekeepers
Inefficiencies: Context, churn, and conflict
The modern toolkit: All hail Excel
i. The Power of Data: Closing the feedback loop
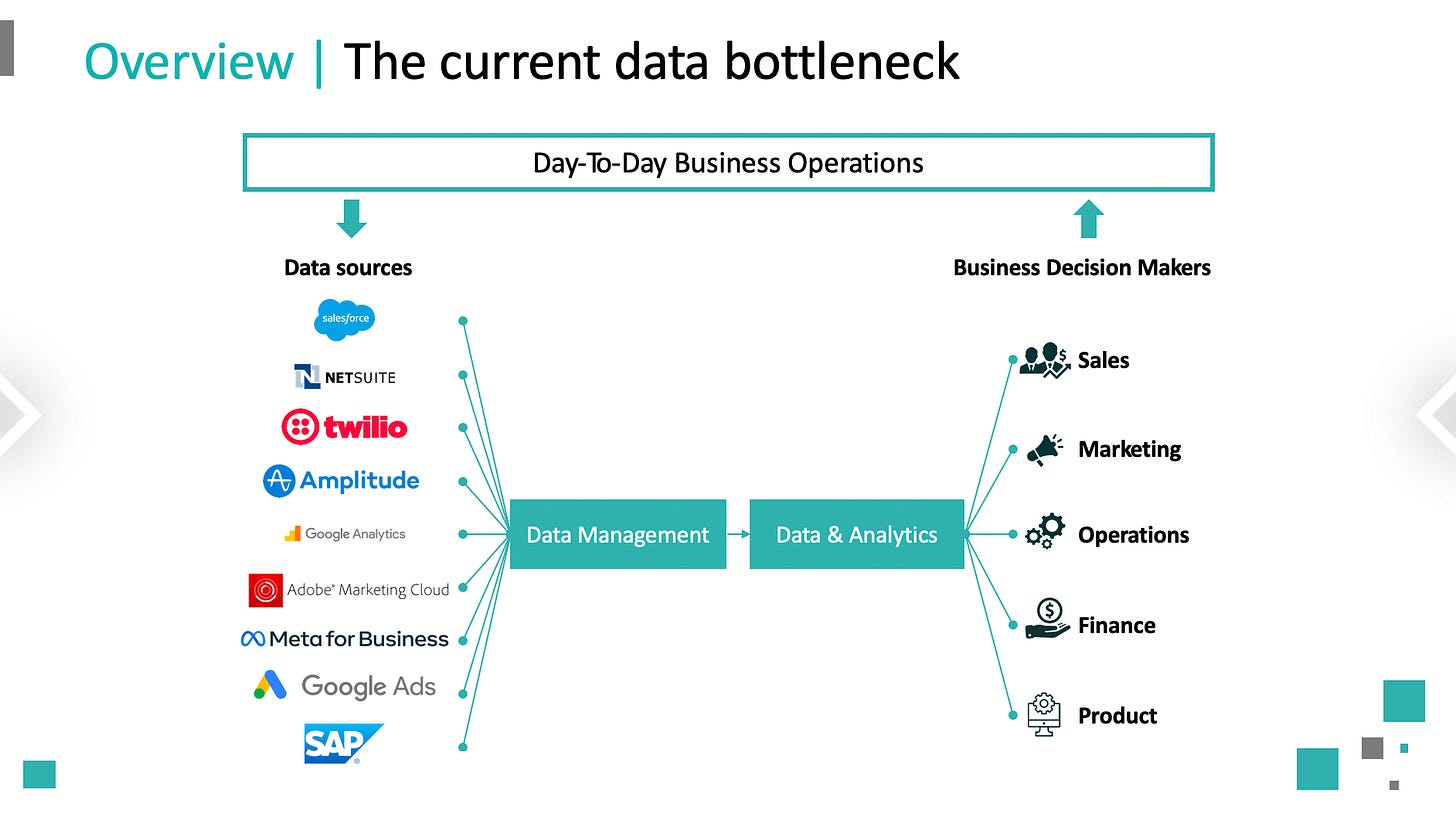
Data is largely powerful because it closes the feedback loop for businesses. With data, we can gain insights that assist in decision-making & measure progress across a complex organization . In theory, the loop is quite simple:
Put simply, digital tools capture data from the business operations. They are cleaned & stored. The Data & Analytics leverages the data to develop actionable insights. The business decision makers leverage these insights to adjust operations. The loop continues. Everyone is happy.
This is, of course, not quite the reality.
ii. Bottlenecks: The data gatekeepers
In practice, it is obviously much more complicated, and unfortunately, it might only be getting worse. Over the years, we have seen an explosion in digital tools like Customer Relationship Management (CRM) platforms, Email Marketing Tools, Digital Advertising, Product Analytics, and many more.
The surge in digital tools has dramatically increased the demand within organizations for actionable insights. Whereas marketing teams previously relied on third-party reporting, they can receive actionable data from digital platforms (e.g., Google Ads, Salesforce).
The number of data sources is increasing. The overall volume of data is increasing. The number of teams & reporting required is increasing. The pressure to keep the data secure is increasing. Naturally, this places extreme pressure on the data management tools & data & analytics teams.
In the context section, we discussed how data management tools have dramatically improved to meet demands (e.g., data warehouses, AI/ML). But data & analytics teams are still limited.
There are huge talent gaps in data science & data engineering, and business decision makers are fully blocked if they cannot write SQL. This is creating huge organizational bottlenecks.
iii. Inefficiencies: Context, churn, and conflict
Bottlenecks create extreme inefficiencies. In many organizations, there are a limited number of data & analytics (D&A) capacity with an extremely large number of requests. In addition to sheer volume, there is a context problem. Let me explain.
D&A is handling requests from every field of the business (e.g., sales, marketing). For sales, that may mean context on customer calls & demos (e.g., how the customer uses the product). For marketing, that may mean context around in-person events or digital campaigns (e.g., new ad campaigns).
Even if D&A had that hands-on experience, it would be impossible to have the proper context across so many aspects of the business. The only person with enough context for the data reports is the subject matter expert (SME) → the person making the request.
Why does this matter? Consider this example.
A marketing manager needs data on how their latest campaign impacted sales. They decide on a few Key Performance Indicators (KPIs), file a JIRA ticket, and meet with the data analyst to walk through the dashboard / data pull they need.
Everything goes fine, and a few days later, the data analyst passes over the data.
Once the marketing manager begins pulling apart the data & reports, follow-up questions emerge (understandably). Maybe there is an anomaly they need to fix. Maybe they need a new cut in the data. But for a variety of reasons, they have more questions & need more answers for the reports to be applicable to the business.
So... they file another JIRA request. And maybe the data analyst has moved onto another project for sales. Due to limited capacity, the next turn on the data may take a few days, and in all likelihood, the data analyst is annoyed the marketing manager is causing more work. This sometimes takes 3 or more turns!
iv. The modern toolkit: All hail Excel
One obvious solve is to give business decisions self-serve methods. There are two main genres that are used today (with non-exhaustive examples):
Spreadsheets: Excel, Google Sheets, Smartsheet, Airtable
Business Intelligence (BI) Tools: Tableau, PowerBI, Looker, Domo
Neither of these genres, however, are a complete solve. Both of them typically function off a "cube" which is a prepared subset of data to work off. The data is modeled by the D&A team, and they then provide it to the business teams in a format usable across a spreadsheet or BI tool.
These two genres each have their pro's & con's seen in Exhibit 6.
Generally speaking, spreadsheet tools excel (pun intended) in places where BI tools do not & vice versa. In many cases, people may use both!
BI tools have of course had a major impact & success. Google acquired Looker for $2.6B, and Salesforce acquired Tableau for $15.7B!!!
But ultimately, Excel continues to reign as king with 258M paid users & monthly usage up 30% year-over-year. Ultimately, users still seem to favor the familiarity, ease-of-use, universality, and functionality of Excel, despite a critical flaw in Excel... it is static. The data & reports do not update over time.
Enter Sigma Computing.
The solution: Bringing Excel functionality to the data warehouse
To best understand Sigma Computing, let's walkthrough:
A) the founding story
B) the product
C) the technical challenges
A. The founding story
Rob Woollen & Jason Frantz founded Sigma Computing in 2014. Both came from Sutter Hill Ventures. Led by Mike Speiser, Sutter Hill Ventures is famous for their ability to incubate and build enterprise companies.
They founded the company to solve the exact problem I laid out above. There were dramatic improvements to cloud data architecture, but largely, business decision-makers were using the same tools (Excel). If you do not write SQL, tools like Snowflake remain largely irrelevant.
Frantz & Woollen led a team of ~5 core engineers for a few years, iterating & testing different solves to this hairy problem. By 2017, they had a prototype that was some hybrid of K, Excel, & JSON. In April, they decided to present their solution to the CEO of Snowflake, Bob Muglia.
A month before the meeting, however, Frantz & Woollen realized the pitch would be a bit odd. Their current prototype would require moving data out of the warehouse. Essentially, their pitch would be telling Muglia to move data out of the product he had been building for years. Recognizing this, Frantz & Woollen fully rebuilt a prototype on top of the data warehouse. The second prototype shared basically no code with the first.
When they had the pitch with their new product, Muglia and the Snowflake founders (Benoit Dageville & Thierry Cruanes) loved it! Muglia had SQL Server under him at Microsoft years prior, so he knew the space well. This meeting is the first time Frantz & Woollen truly felt they found the solution to this problem.
B. The product
Years later, Sigma Computing has been building the cross-section of traditional BI tools & spreadsheets. They are bringing traditional spreadsheet functionality to the data warehouse.
It is the best of both worlds! But let's walkthrough how this actually plays out. Consider three main 'layers' to the D&A process:
Database layer
Functional layer
Visual layer
The database layer aggregates & stores the data as needed. The functional layer allows us to manipulate & cut the data as needed. The visual layer helps us read the data.
All three steps are critical to a quality data loop. As we have discussed, data sources have increased, and as a result, the database layer has improved dramatically. In addition, we have seen BI tools tackle the visual layer. But at the core, the functional layer has remained either Excel, which has its limitations, or SQL, which requires the data & analytics team.
In Exhibit 9, I lay out some typical scenarios, including what it looks like with Sigma's solution. By building the cross-section of spreadsheets & BI tools, Sigma is essentially making the functional and visual layer completely accessible to people without SQL!
Solving for all three layers is a critical component to meeting all the requirements needed. Let's walkthrough why.
Database layer
The market has been tackling this layer for years. Snowflake. Fivetran. Databricks. All of these previously mentioned companies are making the database layer extremely powerful (in many complicated & unique ways).
Spreadsheets, however, fundamentally limit this innovation. At some point, moving to a spreadsheet (scenario A, B, & C) moves the data from a scalable, live, & extremely powerful cloud environment to a static environment limited by row count & processing power.
The first critical solve is to be cloud-based.
Functional layer
In the functional layer, there are two primary methods today:
Export to a usable Excel document
Prepare a 'cube' of data using SQL to pipe data into a BI tool
Note: You very well could use SQL to prepare a specific Excel export as well
#2 is the most scalable, as well as produces live & refreshable visualizations, but A) people prefer the functionality of spreadsheets (e.g., PivotTables, Column calculations) and B) SQL is a limiting factor. Sigma solves for both.
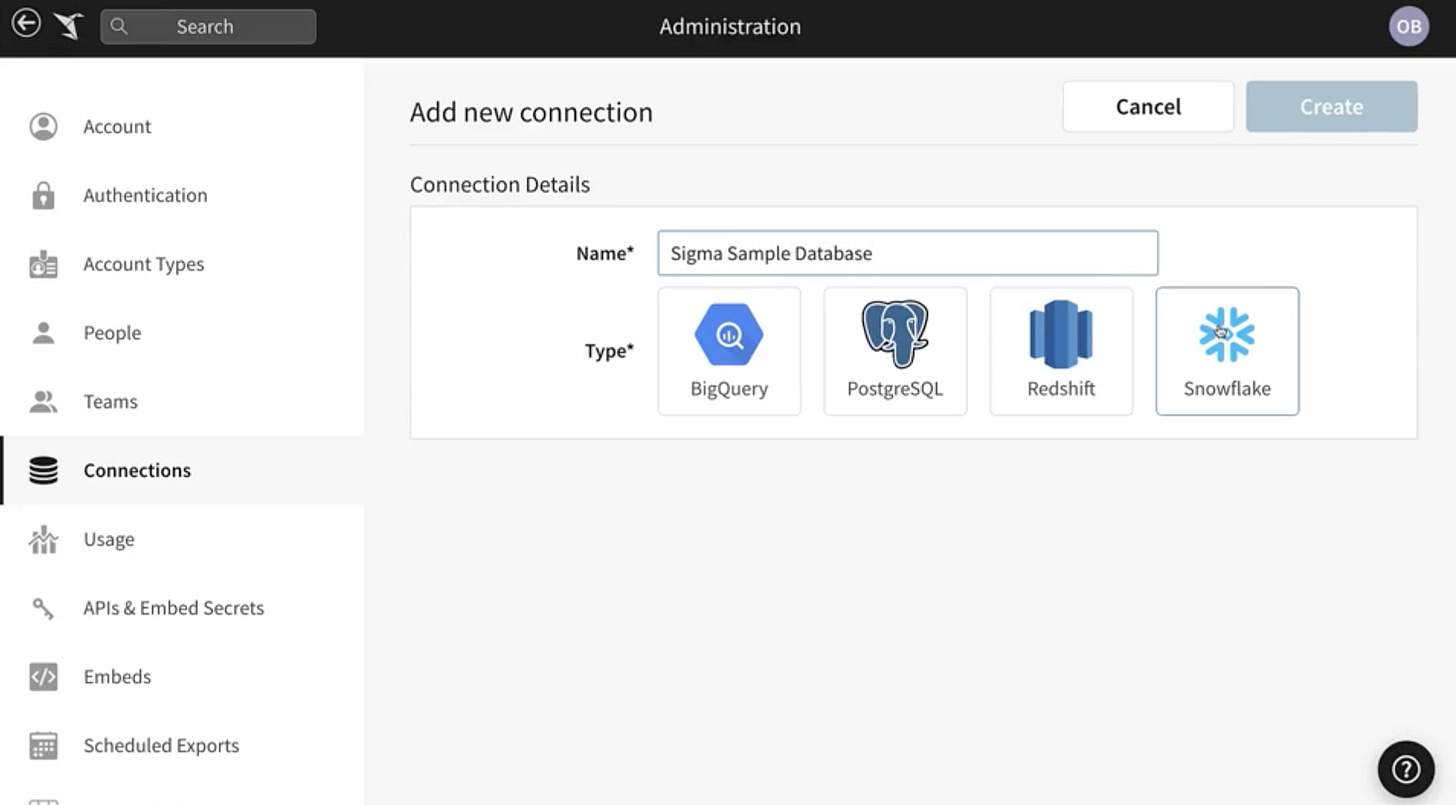
First, you can create a live state spreadsheet by opening it directly on your Snowflake database.
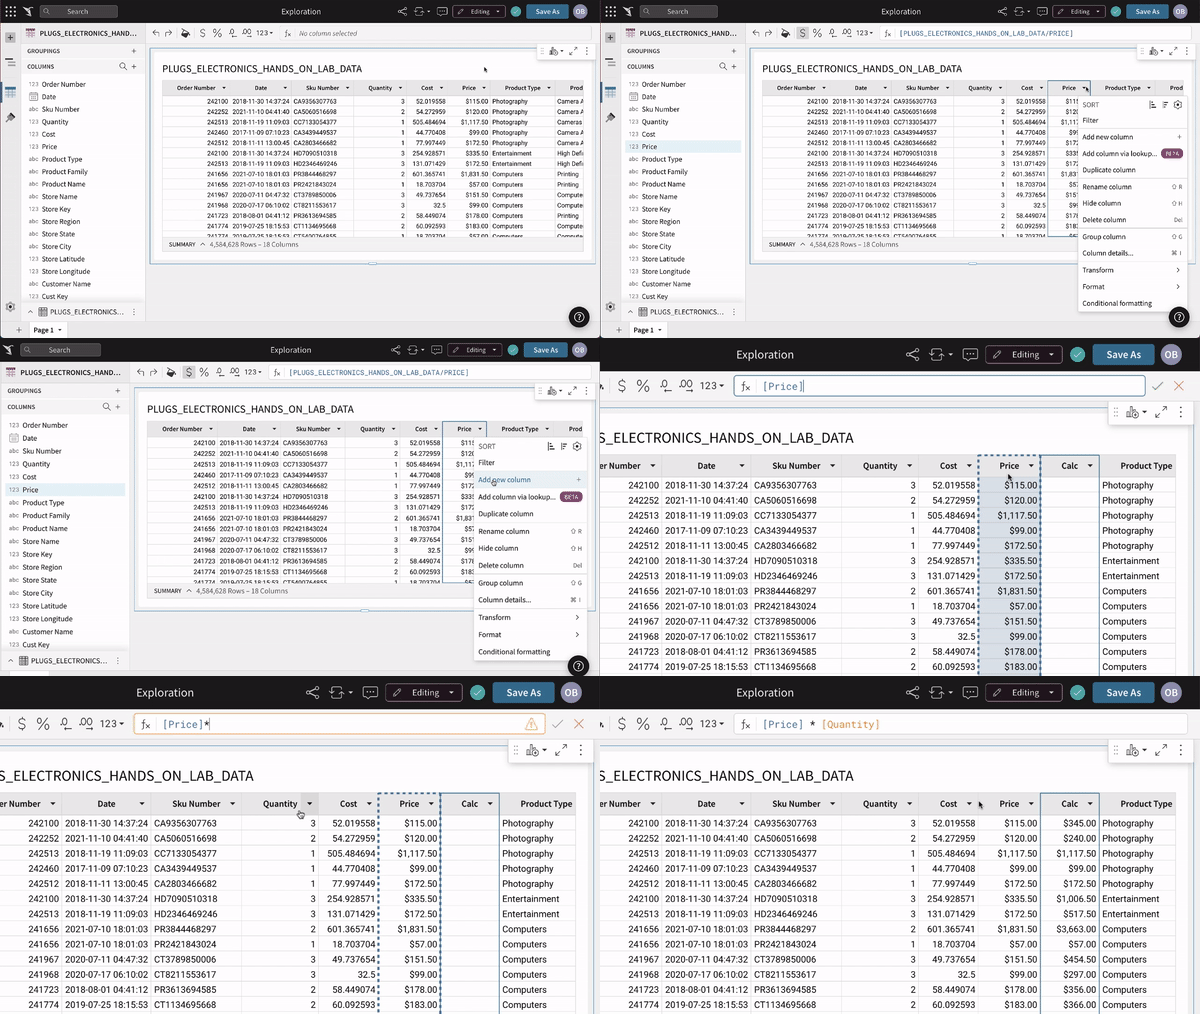
The interface will look very similar to what you expect from a spreadsheet. There is similar functionality too.
For example, you can create & remove columns, as well as column calculations. Except this time, you are executing directly on the live, data warehouse, potentially across billions of rows of data.
Once you have created custom columns, calculations, & naming conventions, then you can seamlessly step into a coveted Excel tool: the PivotTable.
Seamlessly, users can apply their legacy Excel knowledge directly to the power of the data warehouse. For once, they will not have to repeat it periodically. The PivotTable is connected directly to live data!
Up until this point, however, we have not done stuff that cannot in some way or another be replicated in live BI tools. These tools, however, fall short in three places I will talk about today:
Joins (e.g., Lookups)
Two-way data management
In BI tools, you are operating off a pre-prepared 'cube' of data. There are instances, however, where you want to cross-reference multiple different datasets. This bucket of actions would be considered 'joins.'
In the case of a join, you may have two datasets that you want to combine. An example: you have email marketing data & you have point-of-sales (POS) transaction data. Each dataset has a unique customer ID (let's say email address), and you want to combine the data to see a customer's purchase patterns & email engagement side-by-side.
To execute, you would need to write a SQL query merging the two together. You cannot do that in BI tools. In Sigma, however, you can!
A very common type of join in Excel is a "lookup." BI tools do not offer a direct equivalent for the Excel VLOOKUP() or INDEX(MATCH()), but with Sigma Computing you can. When is this useful?
Imagine you run a group of sales reps called Brad, Chad, Thad, and Tad. You sell supplements, and you have them each give samples at different gyms. We then want to be able to track online sales transactions to see if the gyms they visited start purchasing, and hopefully, give them adequate credit!
In Table A, you have the list of gyms each rep visited. In Table B, you have the online transactions by gym.
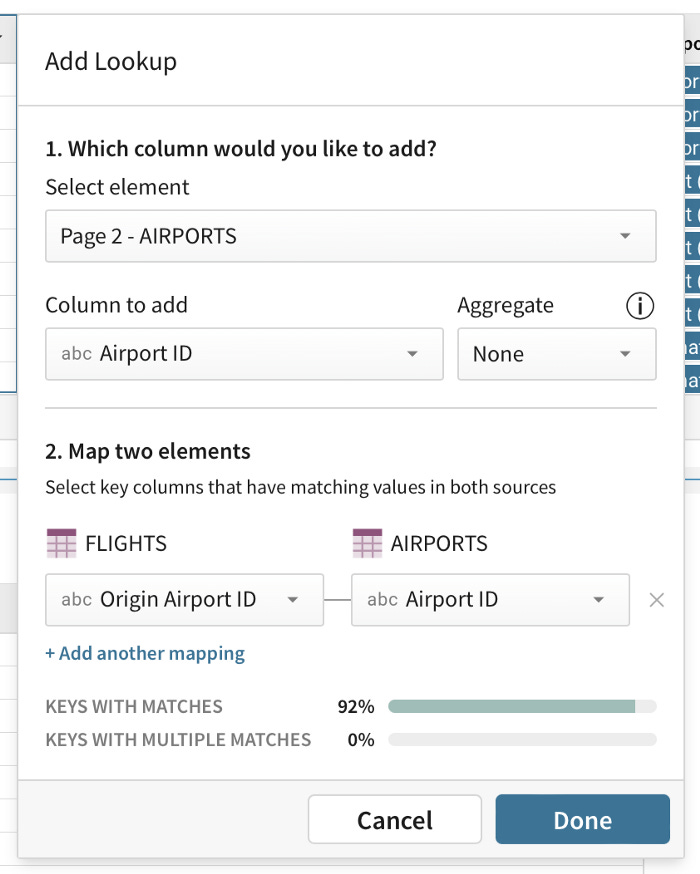
With Lookups, you can quickly map the sales rep to each transaction! Here is an example from the Airport example. Sigma gives easy down menus, and it gives insight into the % of mapping beforehand!
A few more thought-provoking examples:
Marketing: Looking up emails from a marketing event in the entire customer database
Marketing: Mapping store location zip codes to designate marketing areas (DMAs)
Finance: Mapping entire sets of transaction sets to new product categories
In Excel, this can be easy if the data is small (e.g., store example), but it will need to manually be updated as more data flows in. If the data is millions of rows (e.g., transaction data), then Excel will be unable to handle it!
The final feature that is worth noting about Sigma is two-way data management. In BI tools, if there is a skewed data point or a mishap, you cannot adjust the original data source. With Sigma, you can correct it, and it will flow back into the data warehouse, significantly improving data hygiene!
Visual layer
Finally, all of the functionality & data in the world is unusable if people cannot read it. Sigma Computing started as a solve to the functional layer, but ultimately, they realized they need to provide BI-level tools to compete.
From any spreadsheet, you can quickly click into a pre-made or custom visualization. Conversely, from any visualization, it is very easy to click into the underlying data.
Additionally, they have layered all of the visual features you would expect from a BI tool to create real-time, intuitive dashboards.
Many of these visuals may seem familiar or like 'table stakes.' Many BI tools have them. That is true, but nobody offers it with this type of functional layer. To accomplish this in Tableau, you need to upload a pre-prepared csv (with static data), or you are gatekeeped from someone who can leverage SQL!
Sigma give all of this power in one place!
C. The technical challenges
How does Sigma Computing actually work? Well, most of that is secret, but there are a few interesting concepts to consider:
Auto-generating SQL
Balancing latency & UX
The shift from the warehouse to the browser
Put simply, Sigma is a SaaS solution that auto-generates SQL. It replaces the need to know SQL by simply auto-generating it for you. This reduces reliance on the middle man!
This technological feat is not easy to say the least. It is quite resource intensive, and consistent calls to the data warehouse have technical implications.
For this reason, the team is constantly balancing improving latency (e.g., can you make it work fast & consistently), without sacrificing the user experience (e.g., can you make something super technical feel non-technical). The importance of this cannot be understated. This is really the 'secret sauce.' Right now, Sigma gives Excel ease, Tableau aesthetics, and peak performance... that is NOT easy. Moving forward, as they innovate, this will be the consistent battle.
Finally, as part of that balance, Sigma will continue to shift resourcing to the browser. What does this mean? If every calculation or adjustments requires a direct call back to the data warehouse... the latency will be terrible. If you can avoid calling back to the data warehouse, it is more efficient and cheaper.
This is where the bulk of Sigma's computing & competitive edge will continue to be. Here are two examples of ways they're creatively problem-solving:
Pulling in subsets of data: When you call on 2B rows, they are not all actually there. They cannot be and cannot fit. So how do we get super smart on which subsets of data we pull in to be functional?
Calculations: When someone calculates a custom column, are there creative ways to execute accurately without calling back to the warehouse?
Conclusion: Time to go 'scary fast'
By now, you hopefully understand the beauty of the solution Sigma Computing is building. Organizations will operate entirely differently with Sigma. With their solution businesses can reduce the bottleneck pressure on the data & analytics team, reduce needless churn, and more quickly complete the data feedback loop!
With $300M of recent funding, Speiser wrote: "Sigma has product-market fit. Now it’s time to pick up the pace. In 2022 we will go faster. And in 2023 and 2024 we’re going to go scary fast."
Appendix
One pager
Investment score
Market Drivers
Growth
Cloud data infrastructure: The explosion in innovation in areas like the data warehouse will continue to expand the gap between the data infrastructure capabilities & the capabilities of current options (e.g., Excel)
Digital tools: The increase in the number of digital tools (e.g., CRM) is increasing the overall # of data points + visibility into complex organizations; quality visibility & insights will continue to be a source of competitive advantage & an area of increased investment
Uncertain
Privacy restrictions: The increased crackdown on data mining, particularly in consumer could reduce the overall leverage of data; in my opinion, this will be minor, and it will have no real impact on the growth of this general market
Headwinds
Artificial intelligence / Automation: If there continues to be an explosion in solutions, then there is a world where some of the data insights & analytics continues to be automated, reducing the need for super heavy, agile BI tools; low probability in my opinion
Market sizing
Spreadsheet
Office 365 had an estimated 258M paid subscribers in 2020; growing at ~30% (Source)
Assume more modest growth; now ~300M users
Estimate monthly purchase of ~$5-7 dollars (Source)
Estimated ~$18-21B annual revenue run rate
Estimated ~50% market share of Microsoft office (Source)
Total Market size of ~$36-42B
BI Tools
Estimated revenue of $1.2B of Tableau (Source)
Estimated ~12% of market share (Source)
~$8-10B in BI tool revenue in 2021
Sigma Computing is playing somewhere between these too. The spreadsheet estimate is more building off full Microsoft Office revenue assumptions which include items like Word, PowerPoint, etc. For that reason, the market & willingness to pay is likely closer to the BI Tools estimate.
Sigma Computing could dramatically increase the size of market by giving full functionality to people who do not know SQL. This will increase the speed of the business, reduce bottlenecks, and demand a premium.


What a great analysis! Thanks for publishing. I can see you put a lot of work in it. What are some other companies you think are interesting to analyze?