Part II - Understanding the basics
The explosion in data, structure of data, cloud data infrastructure, and GenAI

In Part I - The Progression of AI, we discussed a brief history of Artificial Intelligence (AI) and the recent surge in investment. Over the next few parts, we will dive deeper into understanding parts of AI.
To start this process, there is no better place to start than definitions. This graphic may help. If you look for something similar, there are many debates and permutations, but I think this image is pretty good.
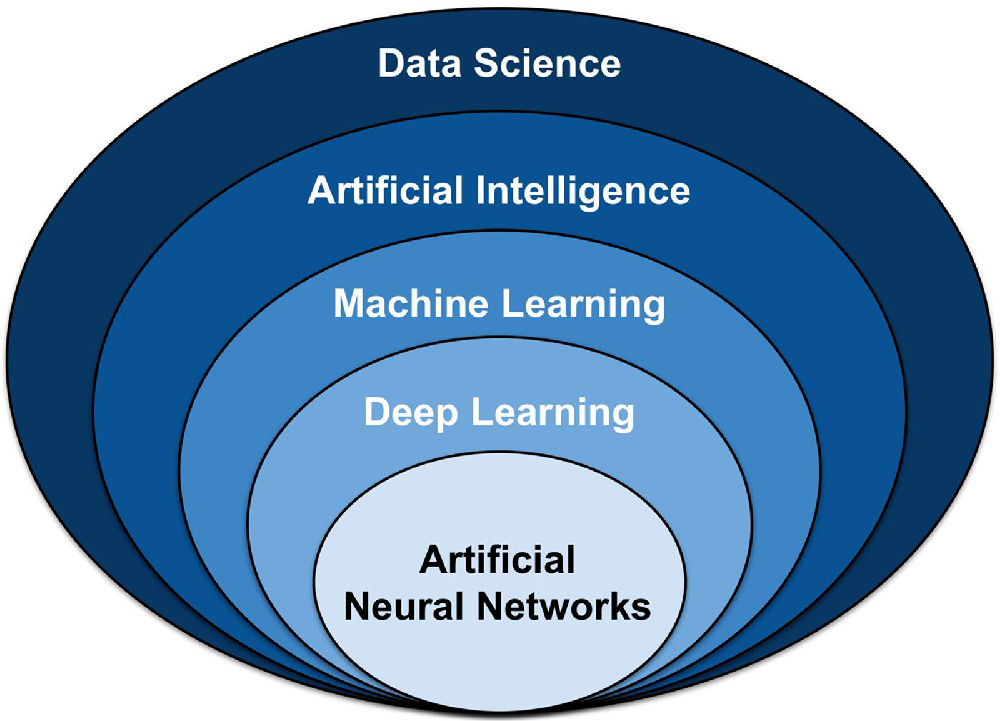
Artificial intelligence is a subcomponent of data science. Machine learning is a subcomponent of artificial intelligence. And so on. Here are the definitions of each:
Data science (Source): The field of study that combines domain expertise, programming skills, and knowledge of mathematics and statistics to extract meaningful insights from data
Artificial intelligence (Source): A branch of computer science dealing with the simulation of intelligent behavior in computers
Machine learning (Source): The process by which a computer is able to improve its own performance (as in analyzing image files) by continuously incorporating new data into an existing statistical model
Deep learning (Source): A subset of machine learning, which is essentially a neural network with three or more layers.
Artificial neural networks (Source): A computational model that mimics the way nerve cells work in the human brain.
Here is my simplified version for now:
Data science → Using data to get insights.
Artificial intelligence → A computer that takes inputs and infers outputs.
Machine learning → A computer that learns.
Deep learning and neural networks → A computer that learns with multiple layers (explained in later parts)
I feel like the graphic breaks down in some places, but here are some important takeaways:
Artificial Intelligence is pretty general. Maybe this is why every company is rebranding as an AI company, even Oral-B toothbrushes! They may not be wrong.
Machine Learning is a subset of AI. Machine learning has been around for years, and somehow, it seems less sexy and topical. In reality, we have been engaging with AI-related tech for years. Think about your Netflix or Facebook algorithms. They learn from you!
Neural networks at the bottom. These are very complex models, and this specific subset is at the core of the breakthroughs you are hearing about with ChatGPT, etc. I will try to explain them in the Part III or Part IV.
The explosion of data
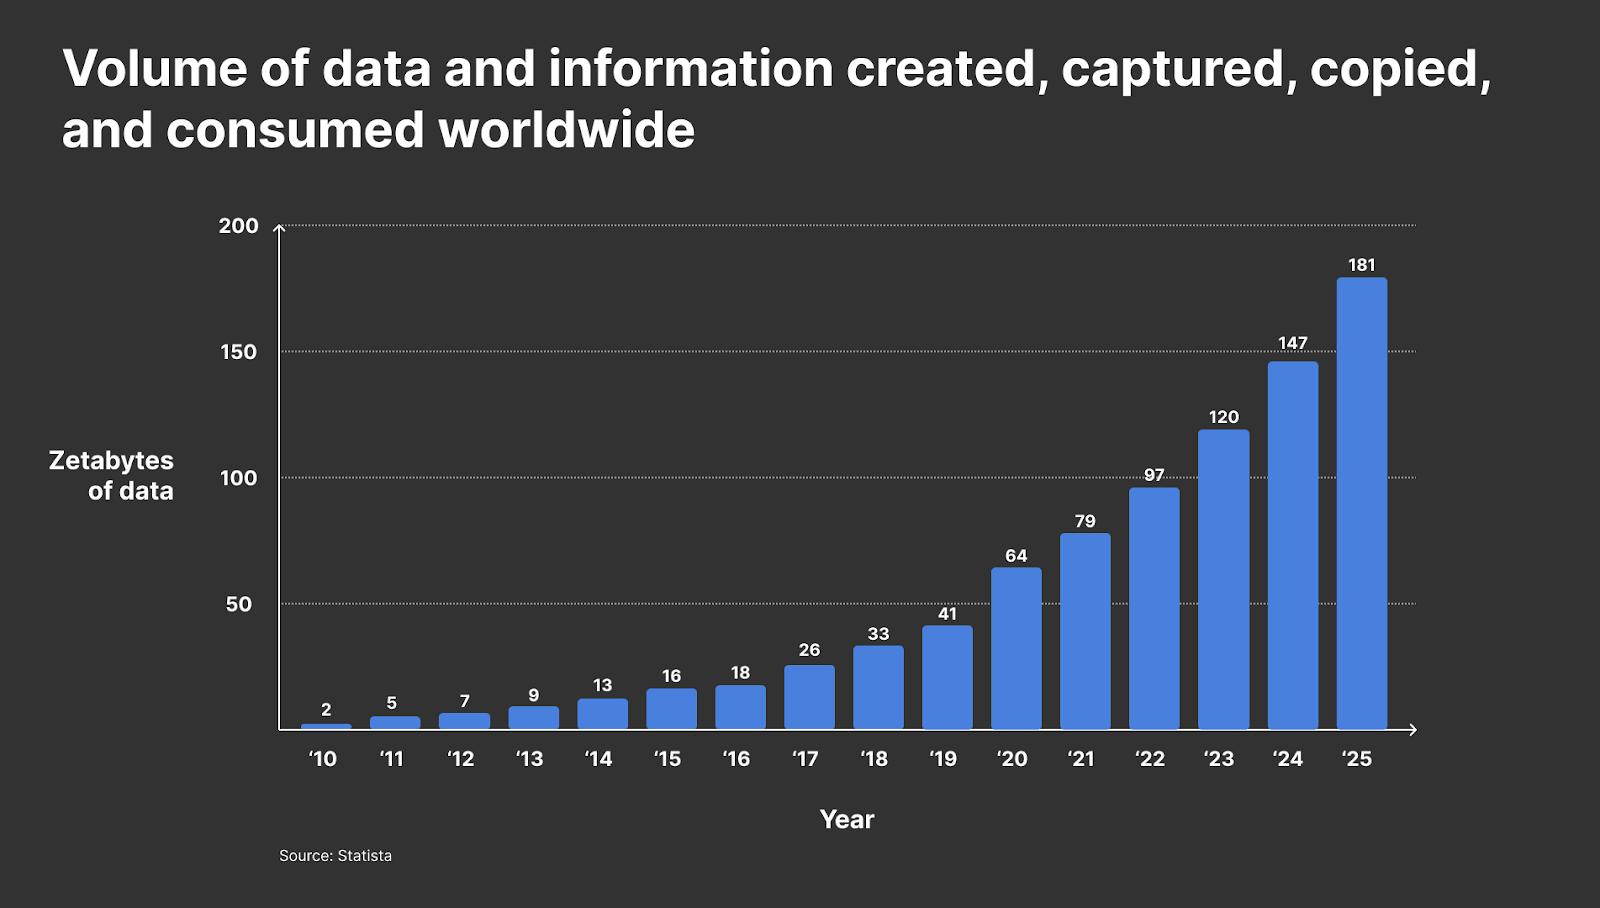
This chart is kind of ridiculous. I am not sure how anyone could calculate the total data out there, let alone project it. I cannot even comprehend Zetabytes. Feels made up.
All of that being said, assume that they calculated in some consistent manner. The sheer volume of data is estimated to have increased 50-100x'd over a decade. Wow.
It’s not slowing down either. This world continues to digitize, and as a result, everything becomes data. Images, videos, and text are visible. But even consider clicking this blog. Substack is logging that somewhere. That’s more data. Purchase data, logistics, and more. This exists everywhere.
Data is gold. Maybe even more so than we imagined. Tapping into these datasets are critical and can drive impact on the order of hundreds of millions of dollars. Facebook and Google’s entire business model is powered by ads, and data is a key part.
Think of AI/ML being applied to data in two large buckets:
Driving understanding and insights
Creating and generating value
I. Driving understanding and insights
Data can tell a lot about a business. Imagine if you had a piece of paper, and every time someone buys a shirt in your store, you marked down with a pencil what they buy. After ten purchases, you see all ten blue shirts were purchased with the same pair of pants. With this information, you could do a lot. Examples:
Buy more blue shirts. Your stock could be running low, so you need to buy more!
Sell a bundle. Sell a package with the shirt, pants, and a pair of socks.
Change the location. Place the pants and shirts close together, or conversely, maybe they place them far apart, so people have to walk by other items to get to both items.
I am not saying to make decisions based on ten purchases. But this is a very simple example of how data can help drive understanding of the business. If you had not marked down the purchases, you may not have noticed the pattern.
Now, imagine how many purchases a store has. What about thousands of stores? And thousands of items? And multiple countries and currencies? The sheer volume of data would be far beyond a single person’s ability to comprehend. That’s where data science comes in.
Data science (theoretically) gives businesses the ability to understand mass quantities of their business data and use it to drive business insights and decisions. I jokingly put “theoretically” because the only thing worse than not using your data... is using it incorrectly. It can lead to really false conclusions with high conviction.
This is why data science is so strongly in demand. The data science job market is estimated to grow by 31 percent over the next decade.
This may still be difficult to conceptualize. But here’s more or less how it works. Companies log all of their data in tables. Here's an example of what it may look like:
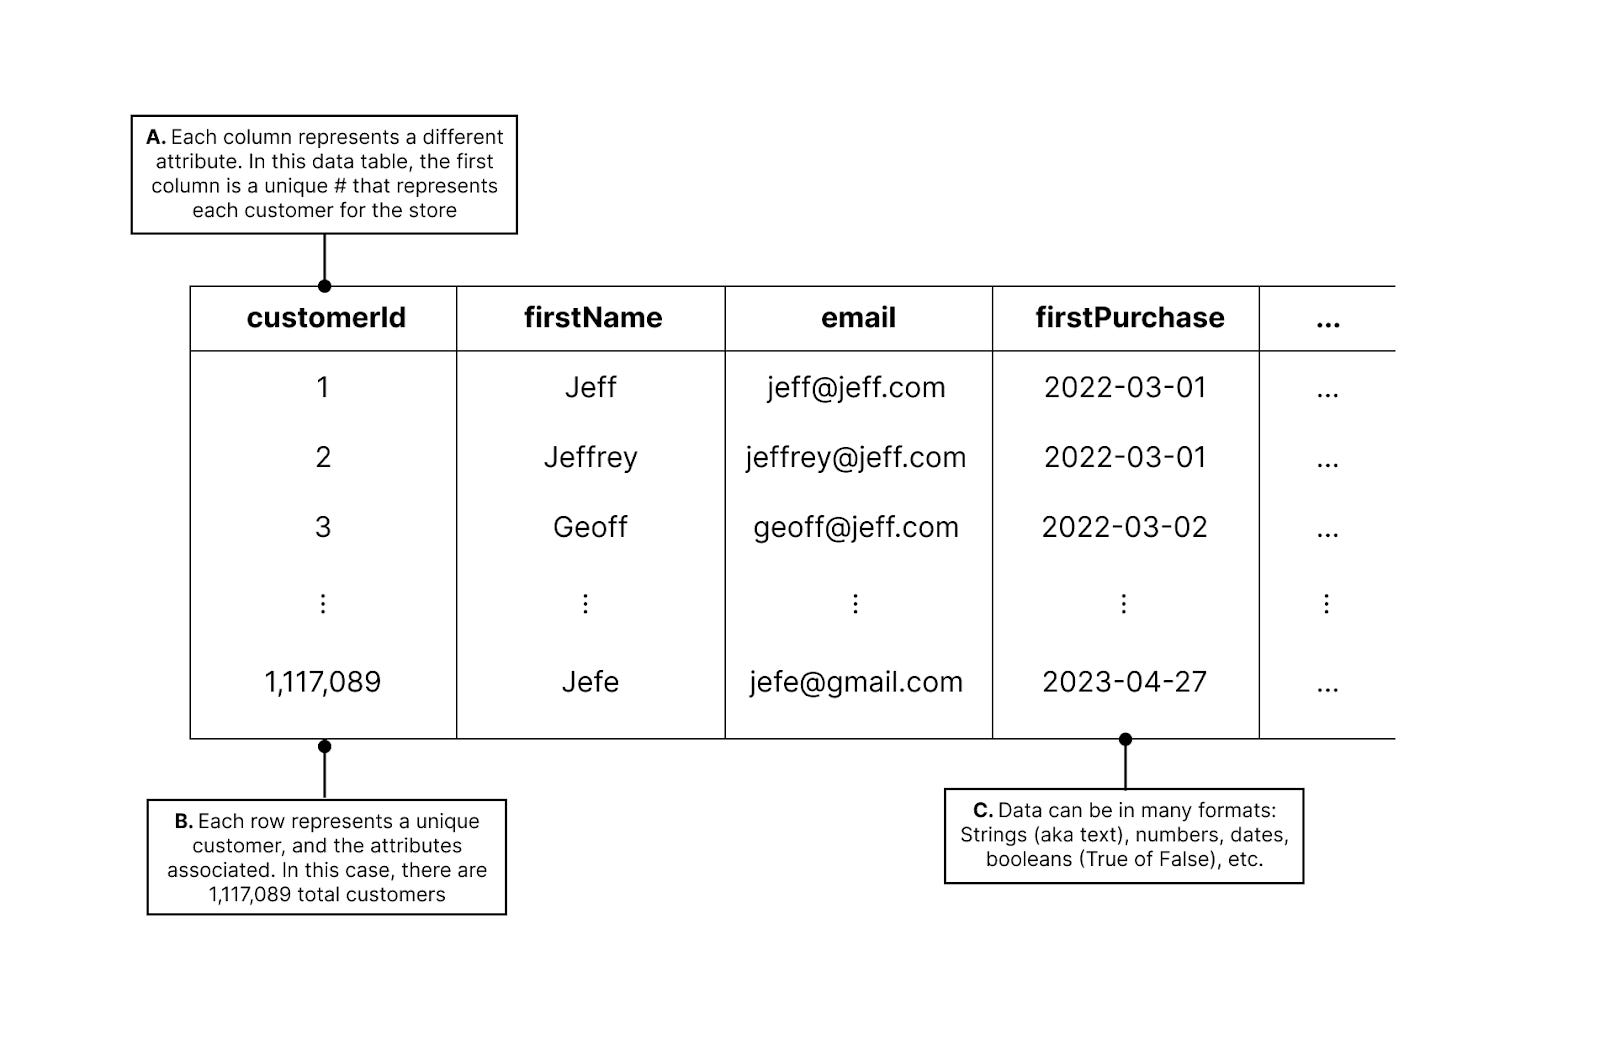
In the example, you can see a variety of different attributes:
The data has many columns. Each one represents attributes. This could be hundreds of columns.
The data has many rows. In the example, there are over one million rows, each representing a customer.
The data has different formats. There are a variety of data types that can exist (e.g., dates, numbers)
This expands rapidly. If you had 10 rows and 10 columns, then there are 100 values in the dataset. Now imagine hundreds of columns and millions of rows. It gets enormous.
If you had questions like:
How many total customers do I have? (Answer: 1,117,089)
What is the name of my first customer? (Answer: Jeff)
When did my first customer first purchase? (Answer: 2022-03-01)
The answers are pretty easy with the screenshot I provided. They are all in Exhibit 3. If the dataset is small, then you would just pull into Microsoft Excel and find it quickly. But these datasets are huge, and Excel uses the Central Processing Unit (CPU) and Random Access Memory (RAM) of your computer. These are your computer resources. Manipulating large datasets will quickly exhaust those resources, which is why it moves slow, freezes, or crash.
In addition, what if you had questions like:
How many times has customer 1 purchased?
What different types of clothes has customer 1 purchased?
When did customer 1 purchase last?
Well, that does not appear to be in Exhibit 3. We only have one row per customer, so it would have to be in columns we cannot see. That’s possible, but it is unlikely.
A decent analogy may be a group text. Each time someone texts, the chain gets longer, and you can scroll up and down to see texts in order. Imagine if instead every time someone texted it was grouped with their name, and you had to map to timestamps to see the order. It would be difficult.
So for transactions, it probably makes sense to log each transaction as a row:
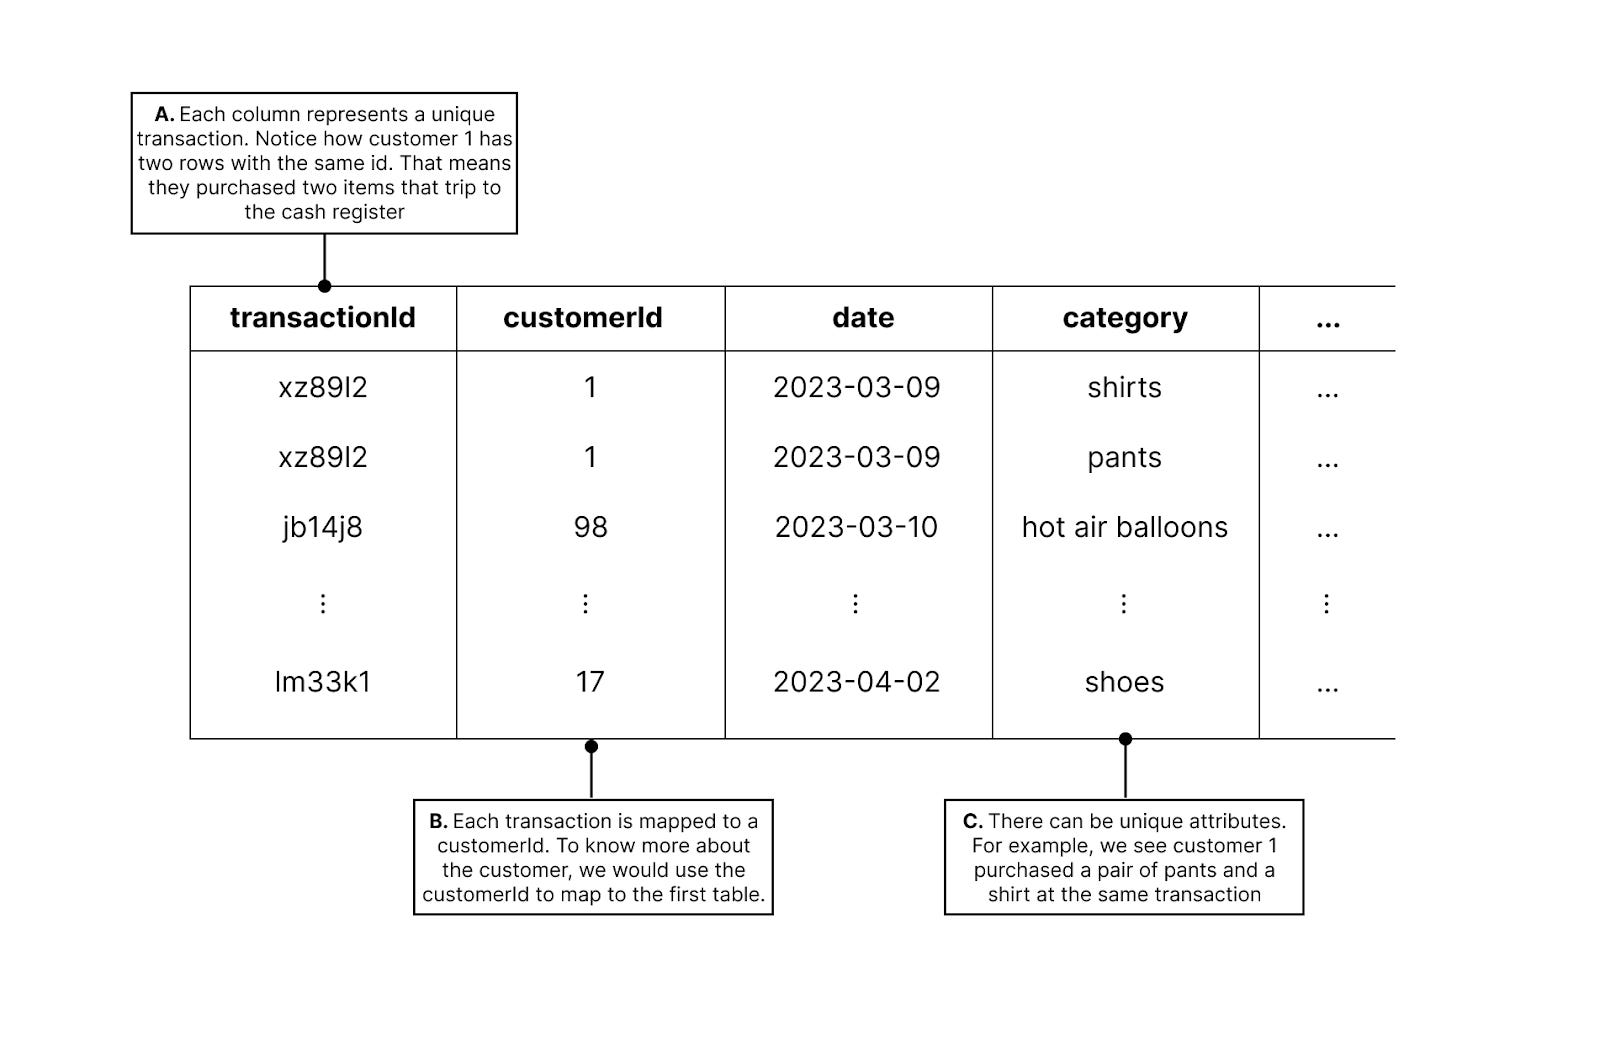
This creates a new table. You can answer the questions above by querying this second table. Imagine if I wanted to email every customer that has purchased only once. You would need to:
Go look at Exhibit 4 to see how many customerIds showed only once
Then you have a list of customerIds, but you need emails
Go look at Exhibit 3 for all of the emails of the customerIds in your list
All of a sudden, you are querying multiple tables, and you are stitching them together. So now you have millions of rows, hundreds of columns, and tens of tables. Your computer cannot handle this. This is why we use the cloud.
The cloud sounds abstract, but it’s pretty simple. There are massive warehouses filled with computers orders of magnitude larger than your laptop. They are called servers. You can store your data there, and you can even do calculations on them. Because they are much larger, they can handle way more. Nearly an infinite amount. It scales well, and it’s pretty cheap.
As a result, the cloud data infrastructure world has exploded. Here are some cloud infrastructure tools across data, analytics, and others:
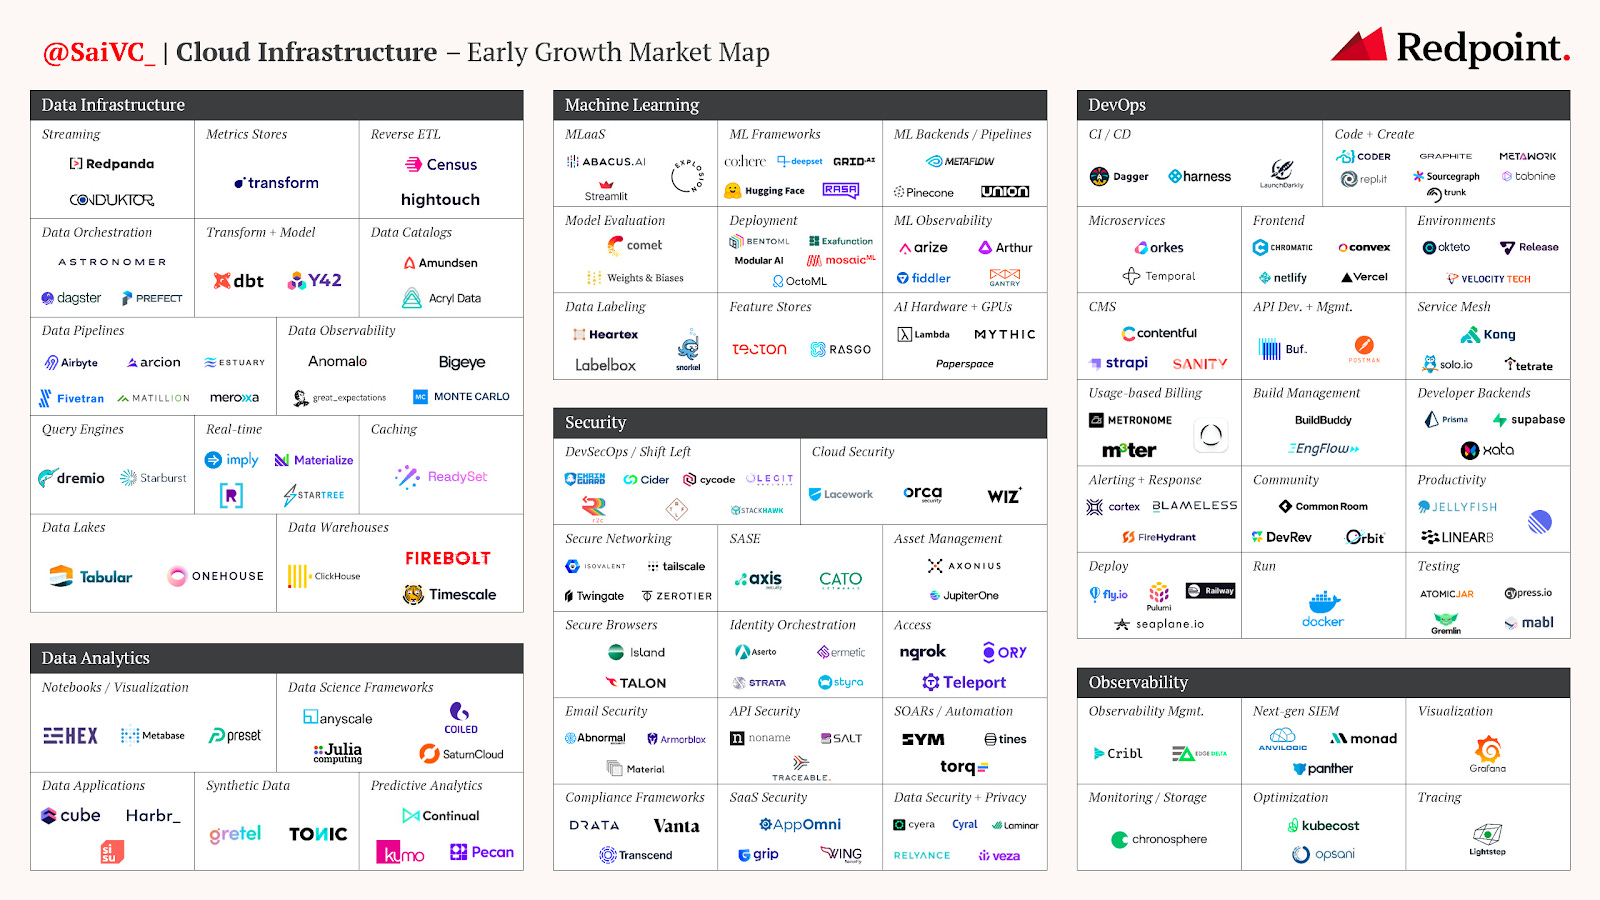
The big data and analytics has become an entire ecosystem estimated at +$200B. Whether it is logging, storing, enriching, or analyzing, businesses are spending a fortune to drive value from their data. AI/ML models are taking this to a new level, and they are great solutions for a few reasons:
Scale - Going from analyzing 10 tasks to 100 tasks would require 10x the people. Computers can scale easily.
Speed - Computers and models can execute these tasks much faster than humans.
Repeatability - A computer can repeat that workflow consistently. A computer dashboard can update that in seconds on an continuous basis.
Because of this, companies that properly leverage AI/ML models can distill their data quickly and consistently, leading to huge step-changes in business insights and product. Companies like Solugen and 64x are two of my favorite examples of real-time software driving core business value. And these models learn over time, so it should continue to improve.
II. Creating and generating value
Until this point, we have focused on how AI/ML can scale to understand large data that humans cannot. In many cases, the insights are just provided and humans can use it however they'd like. This alone has value and could justify the VC investment mentioned in Part I of this series.
Over the past few years, however, we have seen a field called Generative AI emerge. It's a logical next step. If these models can analyze content and make a prediction...then they can create.
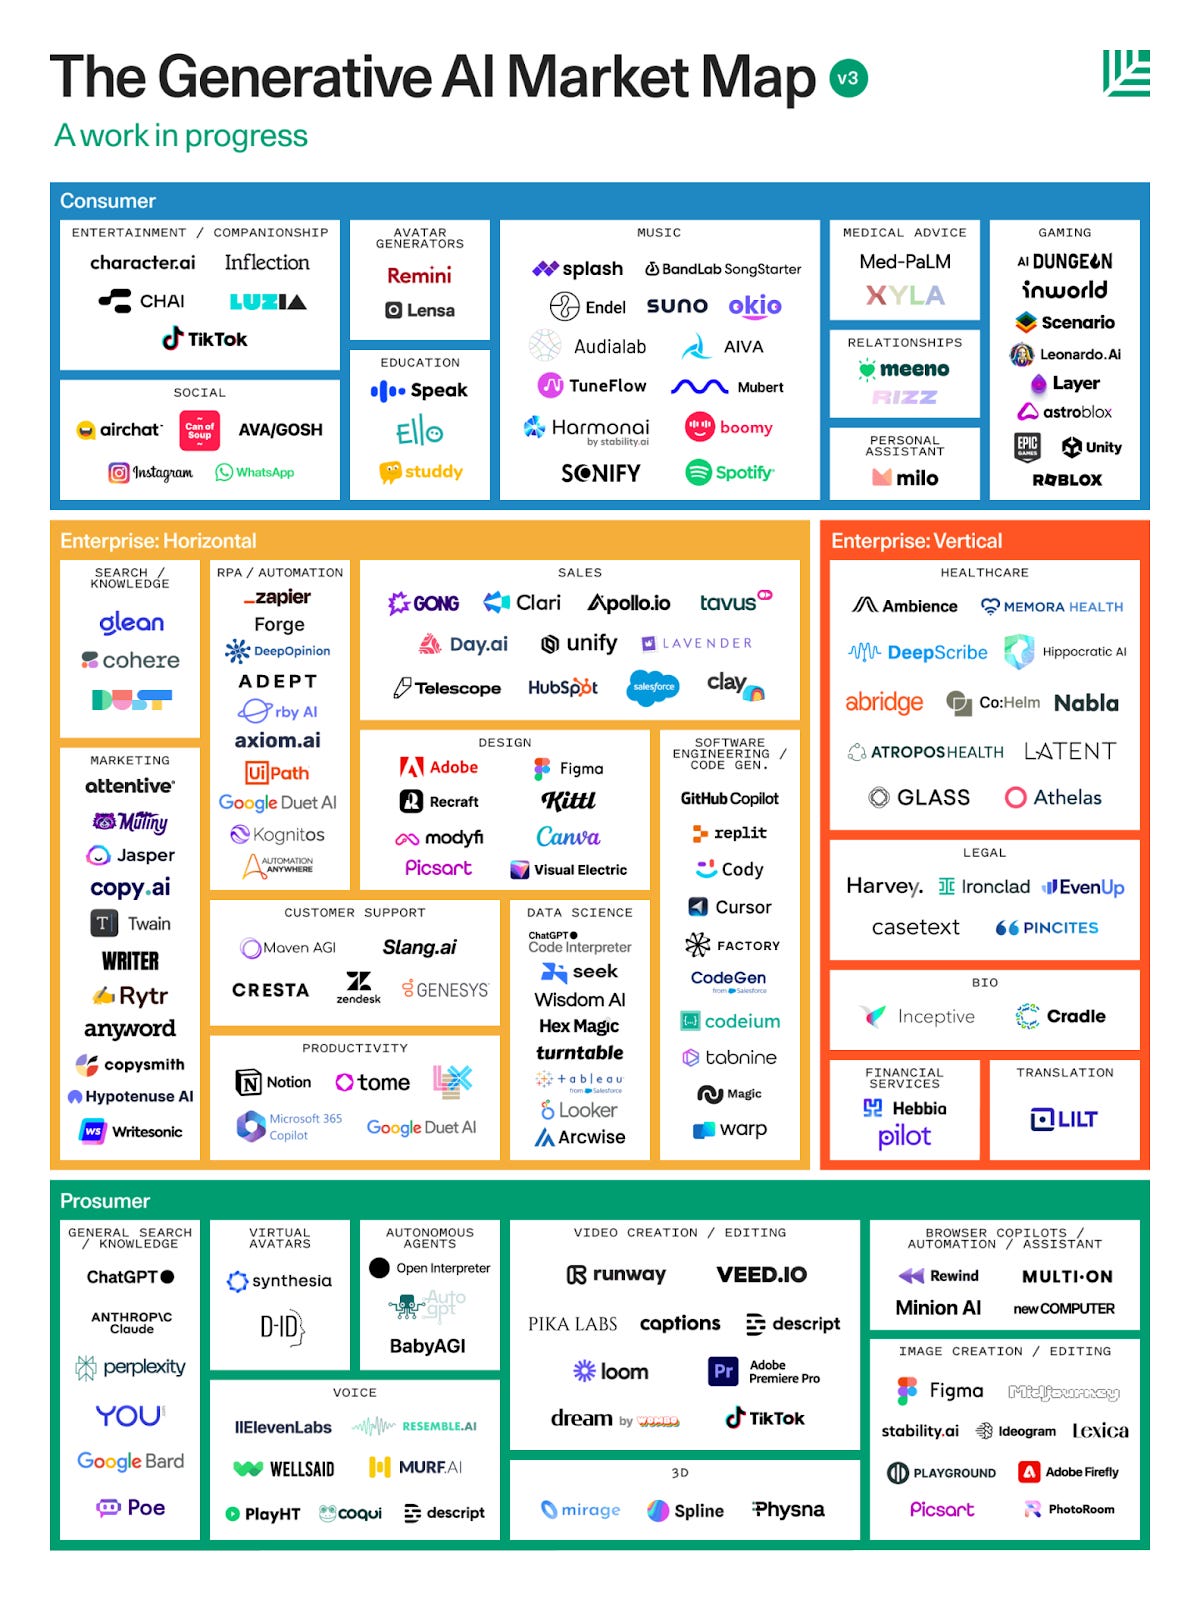
In June 2020, OpenAI released a Large Language Model (LLM) called Generative Pre-trained Transformer 3, GPT-3. This really kickstarted the wave of Generative AI. The later release of ChatGPT and GPT-4 really accelerated the imagination and building. During this time, hundreds of companies have emerged in generative AI. In Q1 of 2023, generative AI companies raised +$1.6B.
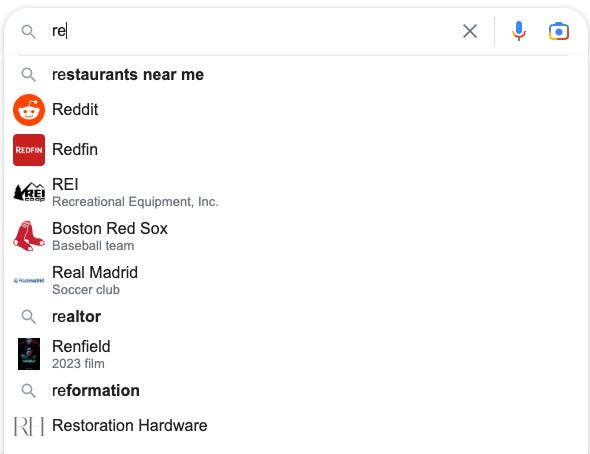
In later parts, we will discuss how these models actually work, but for now, just consider a very basic example: a Google search. When you start typing a query, Google predicts your search. Google looks at your typed characters, and a model begins to predict the most likely queries based on the context it has. This context may be your previous searches, or it could just be basing it off what people in your region are searching for.
This is very basic. Companies in the graphic above are applying this to a much larger level across a variety of spaces like text (e.g., ChatGPT), images (e.g., Stable Diffusion), video (e.g., Runway), and code (e.g., Replit).
Exhibit 8: Example of GenAI with Replit AI
Here’s an example of the coding AI on Replit (my employer) generating code instantly at my request. Within seconds, I ask the AI to change the text on a page, add a button, and add a redirect. Accept the suggestion. Click run. And I have a website live that can do that. It’s that easy with GenAI (and Replit).
And these tools are growing fast. ChatGPT hit one million users in FIVE DAYS.
Summary
In Part I - The progression of AI, we discussed the computer history of AI/ML and the recent investment. Huge breakthroughs like the Transformer, GPT-3, ChatGPT and more led us to today. Venture Capitalists are now investing heavily, so progress continues to accelerate.
In Part II, we provided basic definitions of AI/ML. The explosion of data has led to an investment in both human capital and technical capabilities. AI/ML breakthroughs have shown huge value in 1) driving understanding and insights and 2) creating and generating value.
In Part III, we will dive into the concept of a Neural Network and model training.